3QFY2018 Result Update | Media
February 12, 2018
LT Foods
BUY
CMP
`92
Performance Update
Target Price
`128
Y/E March (` cr)
3QFY18
3QFY17
% yoy
2QFY18
% qoq
Investment Period
12 Months
Net sales
941
790
19.1
853
10.3
EBITDA
86
94
(8.5)
97
(11.8)
Stock Info
Sector
Food Processing
EBITDA margin (%)
9.1
11.9
(275bp)
11.4
(229bp)
Market Cap (` cr)
2,970
A djusted PAT
39
33
16.3
36
5.9
Net Debt (` cr)
1,565
Beta
1.0
Source: Company, Angel Research
52 Week High / Lo
110/49
Avg. Daily Volume
30,429
For 3QFY2018, LT Foods Ltd (LTFL) posted results in line with our expectations on
Face Value (`)
5
top-line and bottom-line fronts. Revenue grew by ~19% yoy to `941cr, driven by
BSE Sensex
34,300
Nifty
10,540
healthy growth in domestic as well as international businesses. On the operating
Reuters Code
LTOL.BO
front, margins contracted by 275bp yoy due to loss of `10cr in European
Bloomberg Code
LTFO.IN
operations and one-time bad debt write off of `14cr. However, lower depreciation
and interest cost boosted PAT growth of ~16% yoy to `39cr.
Shareholding Pattern (%)
Promoters
56.0
Top-line driven by healthy revenue growth in domestic and international
MF / Banks / Indian Fls
15.0
FII / NRIs / OCBs
7.3
businesses: The company’s top-line grew by ~19% yoy to `941cr on the back of
Indian Public / Others
21.7
strong domestic and international growth (up by ~23%). During the 9MFY2018,
contribution of branded revenues to overall revenues has increased from 56% to
Abs.(%)
3m 1yr
3yr
Sensex
2.3
20.0
20.5
61%, while realizations were up by ~14% (`69/Kg Vs. `61/Kg). During the
LT Food
24.2
55.4
703.0
quarter, LTFL has launched the new avatar of leading brand “Daawat” and quick
cook brown rice. These new initiatives are expected to give a new look and feel to
the brand, along with more information to the consumer.
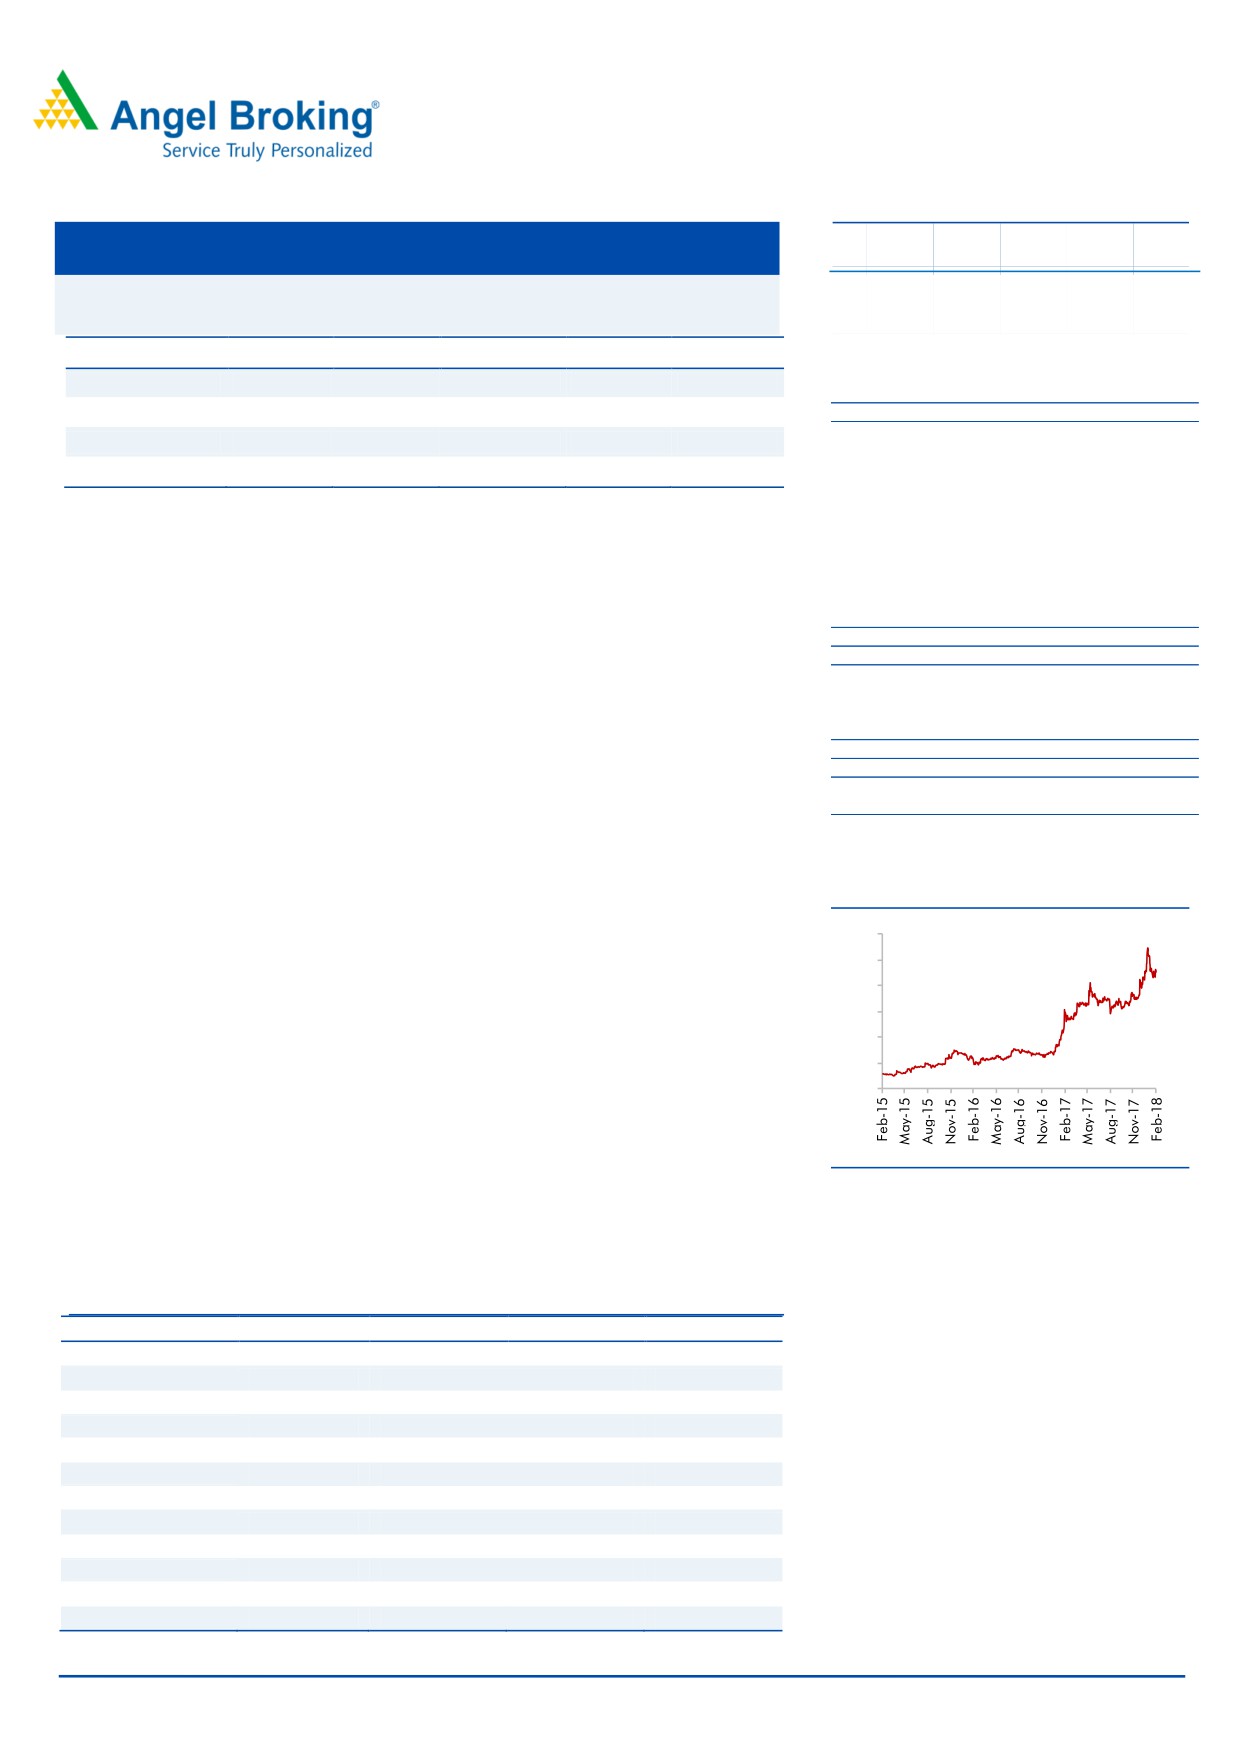
3-year price chart
Lower depreciation and interest cost boosted the profitability: On the operating
front, margins contracted by 275bp yoy due to loss of `10cr in European
120
operations and one-time bad debt write off of `14cr. However, lower depreciation
100
and interest cost boosted PAT growth of ~16% yoy to `39cr. During quarter, the
80
company has raised QIP `400cr which would be utilised to deleverage and to
60
strengthen its balance sheet.
40
Outlook and Valuation: Going forward, we expect the company to report healthy
20
top-line CAGR of 12% over the next two years on the back of strong distribution
0
network & brand, continuing expansion, wide product basket and addition of new
products in portfolio. On the bottom-line front, we expect ~27% CAGR following
robust improvement in operating performance. We expect margin expansion from
Source: Company, Angel Research
better manufacturing efficiency, increase in scale and change in product mix. At
the current market price of `92, the stock trades at a PE of 16.7x and 13.0x its
FY2018E and FY2019E EPS of `5.5 and `7.1, respectively. We recommend BUY
with target price of `128.
Key financials
Y/E March (` cr)
FY2016
FY2017
FY2018E
FY2019E
Net sales
2,973
3,287
3,647
4,122
Amarjeet S Maurya
% chg
7.0
10.5
11.0
13.0
022-39357800 Ext: 6831
Net profit
99
117
147
189
% chg
36.3
18.9
25.4
28.5
EBITDA margin (%)
10.5
11.1
11.2
11.3
EPS (`)
3.1
3.7
4.6
5.9
P/E (x)
29.8
25.1
20.0
15.6
P/BV (x)
5.5
4.5
2.4
2.1
RoE (%)
18.4
17.9
12.2
13.6
RoCE (%)
12.2
13.8
14.8
15.6
EV/Sales (x)
1.5
1.4
1.1
1.0
EV/EBITDA (x)
14.4
12.3
9.9
8.6
Source: Company, Angel Research, Note: CMP as of February 12, 2018
Please refer to important disclosures at the end of this report
1
LT Foods | 3QFY2018 Result Update
Exhibit 1: 3QFY2018 Performance
Y/E March (` cr)
3QFY18
3QFY17
% yoy
2QFY18
% qoq
9MFY18
9MFY17
% chg
Net Sales
941
790
19.1
853
10.3
2543.1
2317.39
9.7
Consumption of RM
713.8
559.51
27.6
608.0
17.4
1841.5
1684.3
9.3
(% of Sales)
75.9
70.8
71.3
72.4
72.7
Staff Costs
34
28
19.9
30
12.4
96.4
81.8
17.8
(% of Sales)
3.6
3.6
3.6
3.8
3.5
Other Expenses
107
108
(0.8)
118
(8.7)
324.9
287.2
13.1
(% of Sales)
11.4
13.7
13.8
12.8
12.4
Total Expenditure
855
696
22.9
756
13.1
2,263
2,053
10.2
Operating Profit
86
94
(8.5)
97
(11.8)
280
264
6.1
OPM
9.1
11.9
11.4
11.0
11.4
Interest
33
41
(18.1)
34.0
(1.7)
106.4
117.6
(9.5)
Depreciation
12
15
(21.2)
9.1
26.5
32.6
42.0
(22.4)
Other Income
18
9
2
28.5
31.9
PBT (excl. Ext Items)
58
47
23.5
56
4.7
170
136
24.4
Ext (Income)/Expense
PBT (incl. Ext Ite ms)
58
47
23.5
56
4.7
170
136
24.4
(% of Sales)
6.2
6.0
6.5
6.7
5.9
Provision for Taxation
20
14
19
60.0
45.1
33.1
(% of PBT)
33.9
29.8
34.7
35
33
Reported PAT
39
33
16.3
36
5.9
110
91
20.2
PATM
4.1
4.2
4.3
4.3
3.9
Source: Company, Angel Research
February 12, 2018
2
LT Foods | 3QFY2018 Result Update
Key investment arguments
Market leadership with strong brand visibility:
LTFL’s flagship brand Daawat enjoys 22% market share in the branded rice market
in India. The company has strong market share in North America selling Basmati
rice under the brand name ‘Royal’. Historically, the company has been focusing on
strong brand visibility, and in order to enhance brand visibility it has significant ad
spend.
Wide distribution network
Currently LTFL has access to 1,40,000 traditional retail outlets, covering 93% of
towns with over 2 lakh population and 3,000 wholesalers. Further, the company
sells its products to premium hotels & restaurants (~50% share), and has access to
6,000 foodservice outlets i.e. ‘DawatChefs Secretz”. Moreover, it has access to
2,500 modern trade stores including 121 hypermarkets, 298 supermarkets and
1,462 mini markets. It is also the first Rice Company to place Brown Basmati Rice
in Medical Chains.
Diversified product portfolio catering to varied customers
LTFL has a well-diversified product basket, which caters to consumers of all income
groups. The company is present in segments like Basmati rice, Speciality rice (non-
Basmati) and other food products. It is also consistently working on adding new
products to its portfolio. LTFL has done JV with Japanese Snack Food major
Kameda, which would launch rice based snacks in India. LTFL has recently
introduced ‘Daawat Rozana GoldPlus’ brand.
Strong global footprint
LT Foods is now an emerging global Foods Company with focus on basmati and
other speciality rice, organic foods and convenience rice-based products. LT Foods
has a global footprint, selling their flagship basmati rice brands Royal and Daawat
into 65 countries. The company has established on ground presence in the US,
Europe and Middle East in order to unlock the full potential of these territories.
February 12, 2018
3
LT Foods | 3QFY2018 Result Update
Outlook and Valuation
Going forward, we expect the company to report healthy top-line CAGR of 12%
over the next two years on the back of strong distribution network & brand,
continuing expansion, wide product basket and addition of new products in
portfolio. On the bottom-line front, we expect ~27% CAGR following robust
improvement in operating performance. We expect margin expansion from better
manufacturing efficiency, increase in scale and change in product mix. At the
current market price of `92, the stock trades at a PE of 16.7x and 13.0x its
FY2018E and FY2019E EPS of `5.5 and `7.1, respectively. We recommend BUY
with target price of `128.
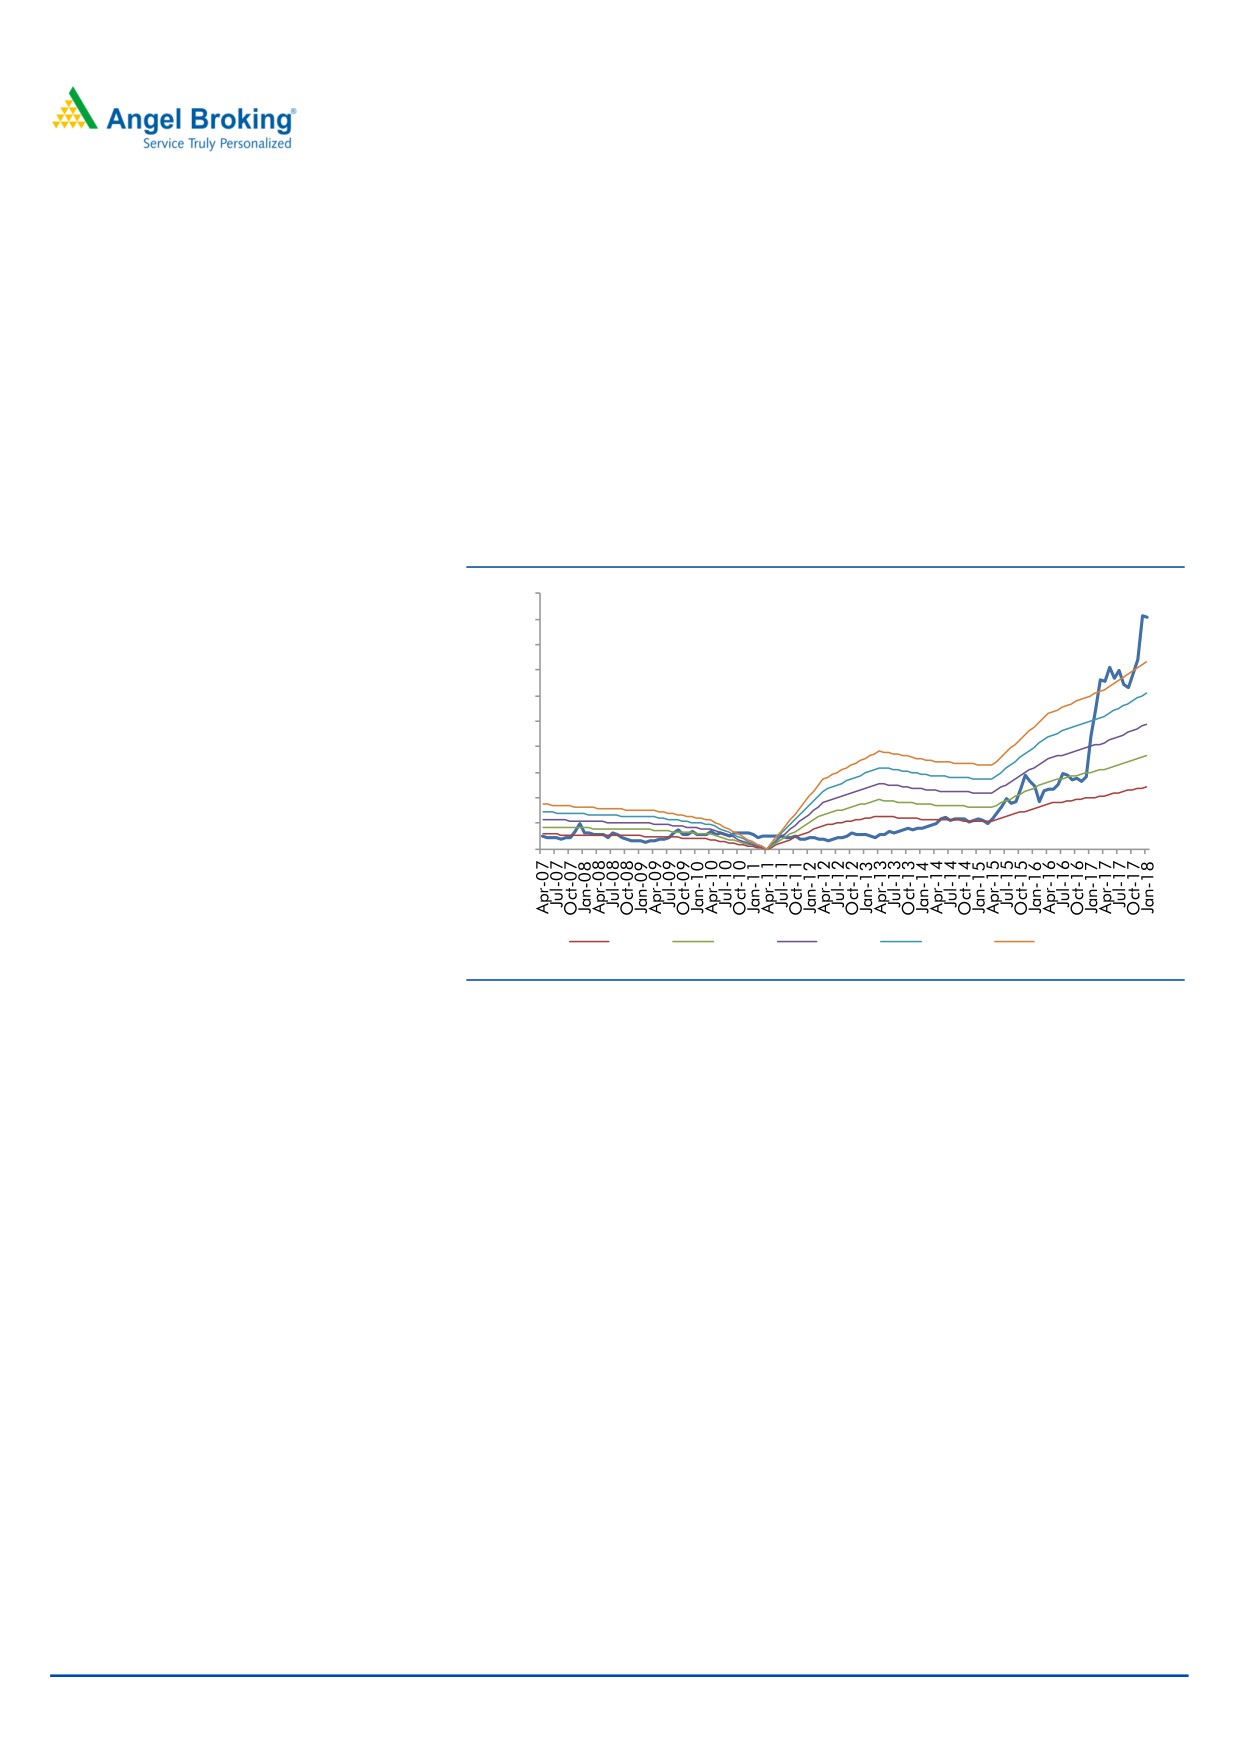
Exhibit 2: One year forward PE Chart
100
90
80
70
60
50
40
30
20
10
0
4.0 X
6.0 X
8.0 X
10.0 X
12.0 X
Source: Company, Angel Research
Risks
Increase in competition from unorganized players would impact overall
growth prospects of the company.
Basmati rice is an extremely volatile commodity. Hence, any unfavorable
change in Basmati rice prices could impact the company’s profitability.
Company derives ~52% revenue from overseas market; any unfavorable
change in currency could have an adverse impact on the company’s
profitability.
Company Background
LT Foods Limited (LTFL) is a branded speciality foods company engaged in milling,
processing and marketing of branded and non-branded basmati rice, and
manufacturing of rice food products in the domestic and overseas markets. Its
geographical segments include India, North America and Rest of the World. The
major brands of the company are Daawat, Gold Seal Indus Valley, Rozana and
817 Elephant.
February 12, 2018
4
LT Foods | 3QFY2018 Result Update
Consolidated Profit & Loss Statement
Y/E March (` cr)
FY2015
FY2016
FY2017
FY2018E
FY2019E
Total operating income
2,779
2,973
3,287
3,647
4,122
% chg
11.5
7.0
10.5
11.0
13.0
Total Expenditure
2,471
2,661
2,920
3,239
3,656
Raw Material
2,076
2,105
2,405
2,677
3,017
Personnel
74
90
117
139
152
Others Expenses
321
466
398
423
486
EBITDA
308
313
366
409
466
% chg
9.6
1.6
17.2
11.5
14.0
(% of Net Sales)
11.1
10.5
11.1
11.2
11.3
Depreciation& Amortisation
47
52
54
50
56
EBIT
261
261
312
358
409
% chg
7.3
(0.0)
19.5
14.7
14.3
(% of Net Sales)
9.4
8.8
9.5
9.8
9.9
Interest & other Charges
151
148
155
143
116
Other Income
1
6
36
25
15
(% of PBT)
1.1
5.2
18.4
10.4
4.9
Share in profit of Associ ates
-
-
-
-
-
Recurring PBT
111
120
193
240
308
% chg
(15.1)
7.5
61.5
24.5
28.3
Tax
35
47
64
79
102
(% of PBT)
31.3
39.4
33.3
33.0
33.0
PAT (reported)
76
72
129
161
207
Minority Interest (after tax)
4
(0)
10
13
17
Profit/Loss of Associate Company
-
(1)
(1)
(1)
(1)
Extraordinary Items
-
(27)
-
-
-
ADJ. PAT
72
99
117
147
189
% chg
(7.5)
36.3
18.9
25.4
28.5
(% of Net Sales)
2.6
3.3
3.6
4.0
4.6
Basic EPS (`)
2.3
3.1
3.7
4.6
5.9
Fully Diluted EPS (`)
2.3
3.1
3.7
4.6
5.9
% chg
(7.5)
36.3
18.9
25.4
28.5
February 12, 2018
5
LT Foods | 3QFY2018 Result Update
Exhibit 3: Consolidated Balance Sheet
Y/E March (` cr)
FY2015
FY2016
FY2017
FY2018E
FY2019E
SOURCES OF FUNDS
Equity Share Capital
26
27
27
32
32
Reserves& Surplus
436
510
630
1,171
1,361
Shareholders Funds
463
537
656
1,203
1,393
Minority Interest
34
34
45
45
45
Total Loans
1,692
1,597
1,612
1,212
1,232
Deferred Tax Liability
5
1
5
5
5
Total Liabilities
2,194
2,169
2,318
2,465
2,674
APPLICATION OF FUNDS
Gross Block
638
676
736
736
766
Less: Acc. De preciation
268
315
365
416
472
Net Block
370
361
371
320
294
Capital Work-in-Progress
15
24
40
40
40
Investments
7
6
5
5
5
Current Assets
2,052
2,065
2,299
2,545
2,847
Inventories
1,362
1,300
1,448
1,609
1,807
Sundry De btors
318
376
463
500
565
Cash
21
32
41
108
146
Loans & Advances
319
189
179
164
165
Other Assets
31
168
167
164
165
Current liabilities
256
296
410
457
522
Net Current Assets
1,796
1,769
1,889
2,088
2,325
Deferred Tax Asset
6
8
13
13
13
Mis. Exp. not written off
-
-
-
-
-
Total Assets
2,194
2,169
2,318
2,465
2,674
Source: Company, Angel Research
February 12, 2018
6
LT Foods | 3QFY2018 Result Update
Exhibit 4: Consolidated Cashflow Statement
Y/E March (` cr)
FY2015
FY2016
FY2017
FY2018E FY2019E
Profit before tax
111
163
195
240
308
Depreciation
47
52
54
50
56
Change in Working Capital
(245)
(69)
(125)
(132)
(199)
Interest / Dividend (Net)
145
140
143
143
116
Direct taxes paid
(50)
(34)
(44)
(79)
(102)
Others
1
45
(7)
0
0
C ash Flow from Operati ons
9
297
217
222
180
(Inc.)/ Dec. i n Fixed Assets
(55)
(53)
(85)
(30)
(30)
(Inc.)/ Dec. i n Inve stments
(3)
(1)
(4)
0
0
C ash Flow from Inve sting
(58)
(54)
(89)
(30)
(30)
Issue of Equity
1
5
2
0
0
Inc./(Dec.) in loans
184
(93)
23
(400)
20
Dividend Paid (Incl. T ax)
(6)
(5)
(4)
0
0
Interest / Divide nd (Net)
(147)
(142)
(145)
286
(132)
C ash Flow from Financing
32
(235)
(124)
(114)
(112)
Inc./(Dec.) in Cash
(17)
8
4
78
38
O pening Cash balance s
35
18
26
30
108
Closing Cash balances
18
26
30
108
146
Source: Company, Angel Research
February 12, 2018
7
LT Foods | 3QFY2018 Result Update
Key Ratios
Y/E March
FY2015
FY2016
FY2017
FY2018E FY2019E
Valuati on Ratio (x)
P/E (on FDEPS)
40.6
29.8
25.1
20.0
15.6
P/CEPS
23.9
23.7
16.1
13.9
11.2
P/BV
6.4
5.5
4.5
2.4
2.1
Dividend yield (%)
0.2
0.0
0.0
0.0
0.0
EV/Sales
1.7
1.5
1.4
1.1
1.0
EV/EBITDA
15.0
14.4
12.3
9.9
8.6
EV / Total Assets
2.1
2.1
1.9
1.6
1.5
Per Share Data (`)
EPS (Basic)
2.3
3.1
3.7
4.6
5.9
EPS (fully diluted)
2.3
3.1
3.7
4.6
5.9
Cash EPS
3.8
3.9
5.7
6.6
8.2
DPS
0.2
0.0
0.0
0.0
0.0
Book Value
14.5
16.8
20.5
37.6
43.5
Returns (%)
ROCE
12.1
12.2
13.8
14.8
15.6
Angel ROIC (Pre-tax)
12.3
12.5
14.0
15.6
16.6
ROE
15.7
18.4
17.9
12.2
13.6
Turnover rati os (x)
Asset Turnover (Gross Block)
4.4
4.4
4.5
5.0
5.4
Inventory / S ales (days)
179
160
161
161
160
Receivables (days)
42
46
51
50
50
Payables (days)
13
18
24
24
24
Working capital cycle (ex-cash) (days)
208
188
188
187
186
February 12, 2018
8
LT Foods | 3QFY2018 Result Update
Research Team Tel: 022 - 39357800
DISCLAIMER
Angel Broking Private Limited (hereinafter referred to as “Angel”) is a registered Member of National Stock Exchange of India Limited,
Bombay Stock Exchange Limited and MCX Stock Exchange Limited. It is also registered as a Depository Participant with CDSL and
Portfolio Manager with SEBI. It also has registration with AMFI as a Mutual Fund Distributor. Angel Broking Private Limited is a
registered entity with SEBI for Research Analyst in terms of SEBI (Research Analyst) Regulations, 2014 vide registration numb er
INH000000164. Angel or its associates has not been debarred/ suspended by SEBI or any other regulatory authority for accessing
/dealing in securities Market. Angel or its associates including its relatives/analyst do not hold any financial interest/ben eficial
ownership of more than 1% in the company covered by Analyst. Angel or its associates/analyst has not received any compensation /
managed or co-managed public offering of securities of the company covered by Analyst during the past twelve months. Angel/analyst
has not served as an officer, director or employee of company covered by Analyst and has not been engaged in market making activity
of the company covered by Analyst.
This document is solely for the personal information of the recipient, and must not be singularly used as the basis of any in vestment
decision. Nothing in this document should be construed as investment or financial advice. Each recipient of this document should
make such investigations as they deem necessary to arrive at an independent evaluation of an investment in the securities of the
companies referred to in this document (including the merits and risks involved), and should consult their own advisors to determin e
the merits and risks of such an investment.
Reports based on technical and derivative analysis center on studying charts of a sto ck's price movement, outstanding positions and
trading volume, as opposed to focusing on a company's fundamentals and, as such, may not match with a report on a company's
fundamentals.
The information in this document has been printed on the basis of publicly available information, internal data and other reliable
sources believed to be true, but we do not represent that it is accurate or complete and it should not be relied on as such, as this
document is for general guidance only. Angel Broking Pvt. Limited or any of its affiliates/ group companies shall not be in any way
responsible for any loss or damage that may arise to any person from any inadvertent error in the information contained in th is report.
Angel Broking Pvt. Limited has not independently verified all the information contained within this document. Accordingly, we cannot
testify, nor make any representation or warranty, express or implied, to the accuracy, contents or data contained within this document.
While Angel Broking Pvt. Limited endeavors to update on a reasonable basis the information discussed in this material, there may be
regulatory, compliance, or other reasons that prevent us from doing so.
This document is being supplied to you solely for your information, and its contents, information or data may not be reproduced,
redistributed or passed on, directly or indirectly.
Neither Angel Broking Pvt. Limited, nor its directors, employees or affiliates shall be liable for any loss or damage that ma y arise from
or in connection with the use of this information.
Note: Please refer to the important ‘Stock Holding Disclosure' report on the Angel website (Research Section). Also, please r efer to the
latest update on respective stocks for the disclosure status in respect of those stocks. Angel Broking Pvt. Limited and its affiliates may
have investment positions in the stocks recommended in this report.
Disclosure of Interest Statement
LT Foods
1. Analyst ownership of the stock
No
2. Angel and its Group companies ownership of the stock
No
3. Angel and its Group companies' Directors ownership of the stock
No
4. Broking relationship with company covered
No
FeNote: We have not considered any Exposure below ` 1 lakh for Angel, its Group companies and Directors
9
Ratings (Based on expected returns
Buy (> 15%)
Accumulate (5% to 15%)
Neutral (-5 to 5%)